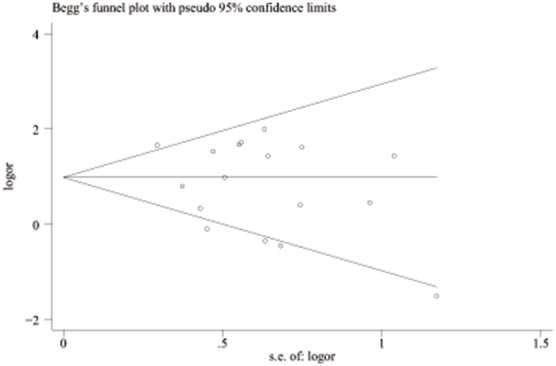
Figure 9. Begg’s funnel plot of publication bias test of severe preeclampsia associated with FVL.

LogOR means nature logarithm of OR (odds ratio). Horizontal line means the summary estimate, while the sloping lines mean the expected 95% confidence interval.
