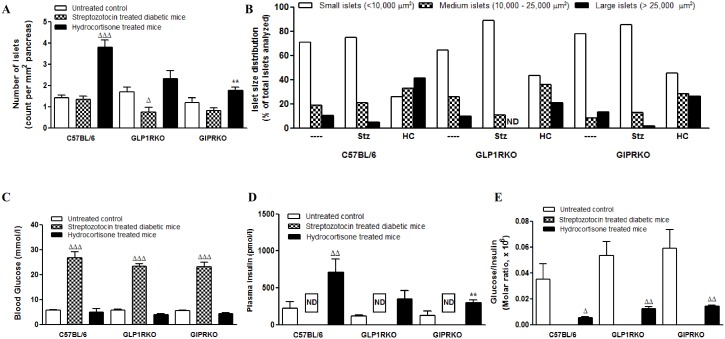
Figure 2. Islet analysis.
A – Number of islets (count per mm2 of pancreas). B – Islet size distribution (% of total islets analysed). C – Blood glucose (mmol/l). D – Plasma insulin (pmol/l). E – Glucose/Insulin molar ratio. Values are mean ± SEM (n = 6). Δp<0.05, ΔΔp<0.01, ΔΔΔp<0.001 compared to respective controls. **p<0.01 compared to respective treatment of C57BL/6 mice.

