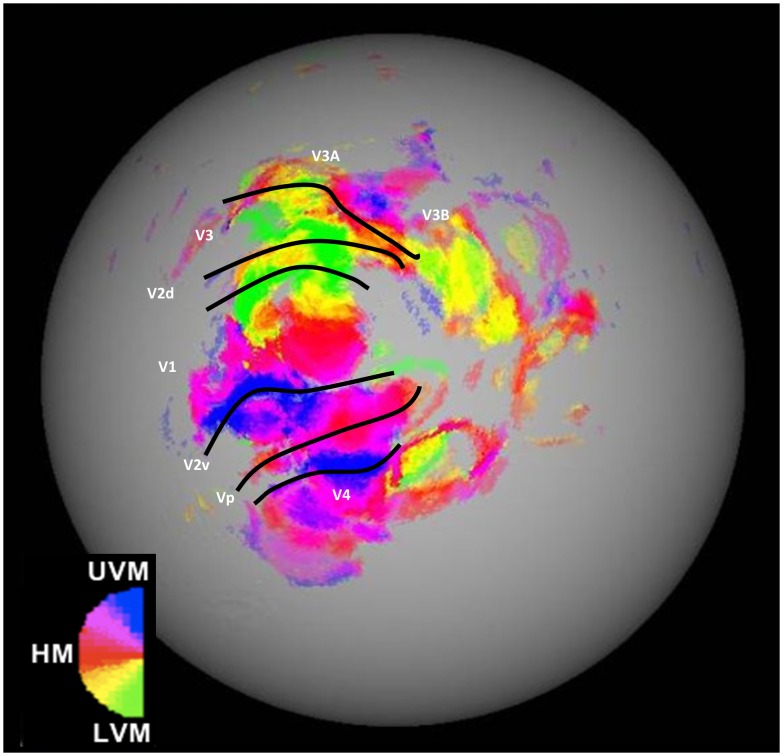
Figure 4. A representative example of a retinotopic map (right hemisphere) from one participant.
Retinotopic map colour scheme represents cortical activity to stimuli in the Upper Vertical Meridian (UVM) in blue, through pink, into red coding for the Horizontal Meridian (HM), though yellow, into the Lower Vertical Meridian (LVM) in green.

