
Figure 3.
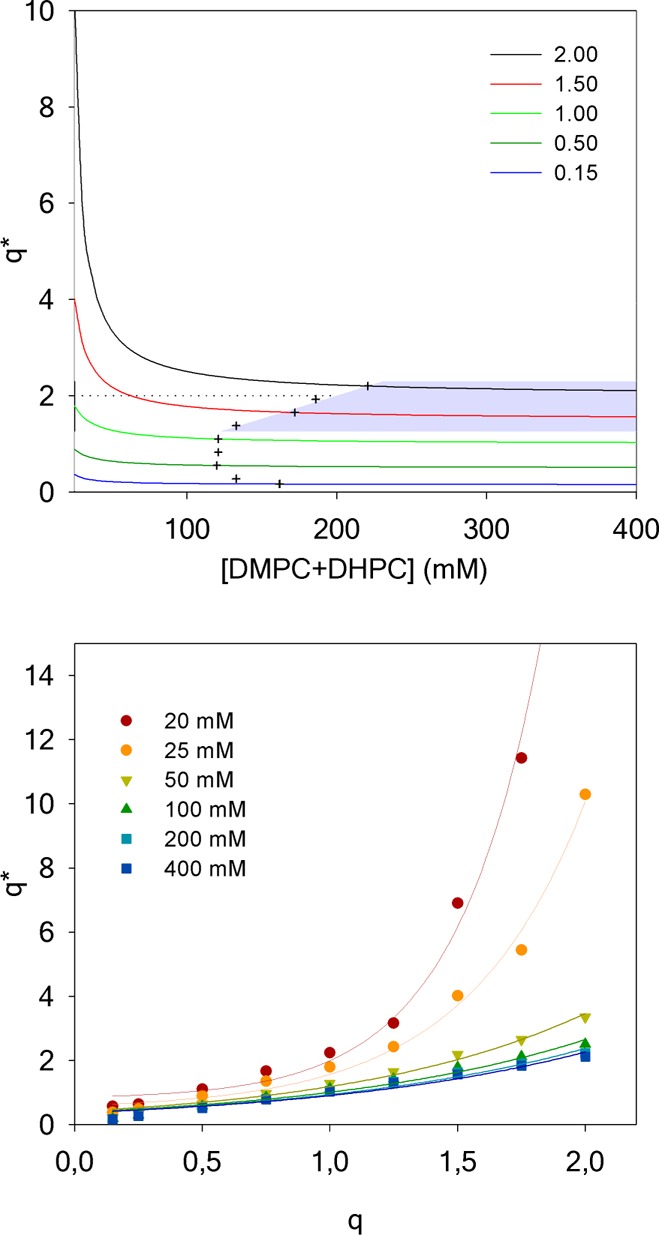
Evolution of the effective q* for DMPC/DHPC isotropic bicelles as a function of sample dilution for several q ratios determined at 25 °C (top). The gray zone is the region where bicelles are isotropic, i.e., below q* of 2.3 (limit of isotropic motion), above q* = 1 (lipid segregation between DMPC and DHPC), and q*= q + 10% (crosses). Value of q* as a function of q for different total lipid concentrations (bottom). Solid lines are a guide to the eye.