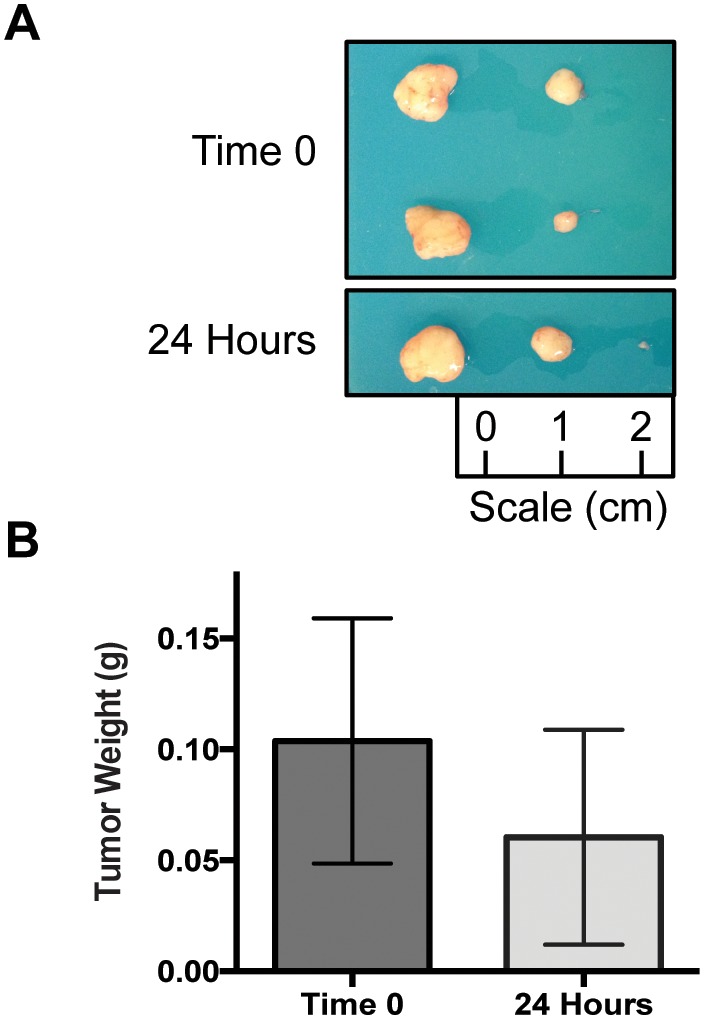
Figure 5. Tumor Pictures and Weights for UW-SCC64.

(A) Photographs of all tumors harvested at the end of the experiment for UW-SCC64. (B) Bar graphs depicting the mean tumor weights for the Time 0 and 24 hour groups in the UW-SCC64 experiment.

(A) Photographs of all tumors harvested at the end of the experiment for UW-SCC64. (B) Bar graphs depicting the mean tumor weights for the Time 0 and 24 hour groups in the UW-SCC64 experiment.