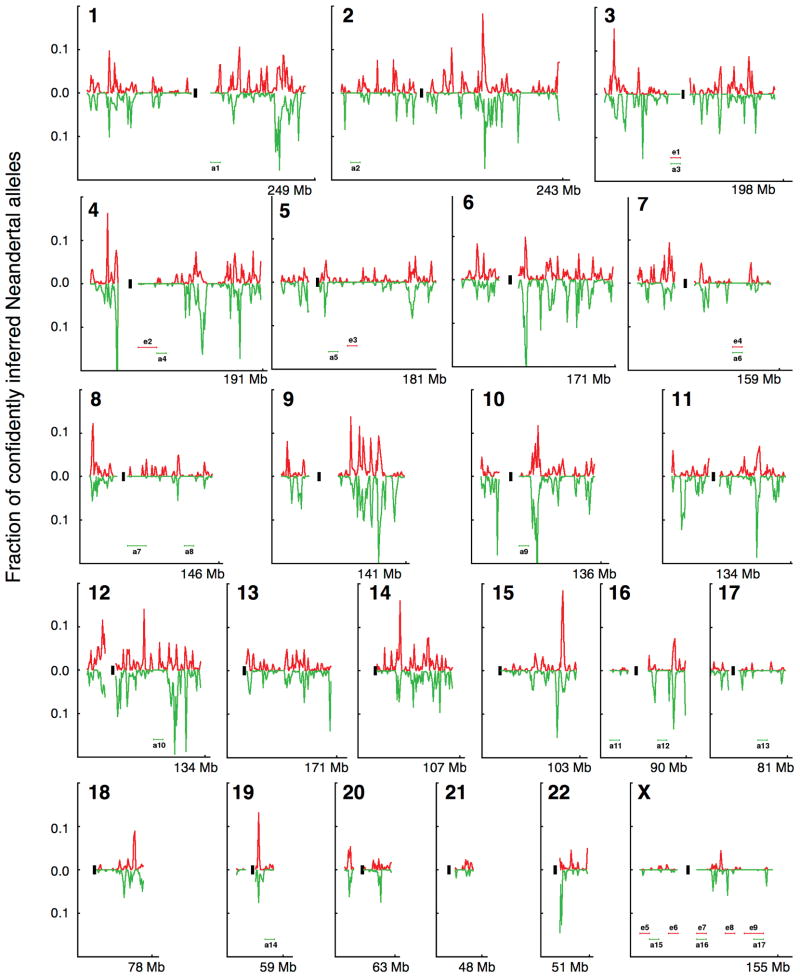
Extended Data Figure 2. Map of Neandertal ancestry in 1000 Genomes European and East Asian populations.
For each chromosome, we plot the fraction of alleles confidently inferred to be of Neandertal origin (probability > 90%) in non-overlapping 1 Mb windows. We label 10 Mb scale windows that are deficient in Neandertal ancestry (e1–e9, a1–a17) (SI 8).

