
Figure 1. Gross and immunohistochemical sections.
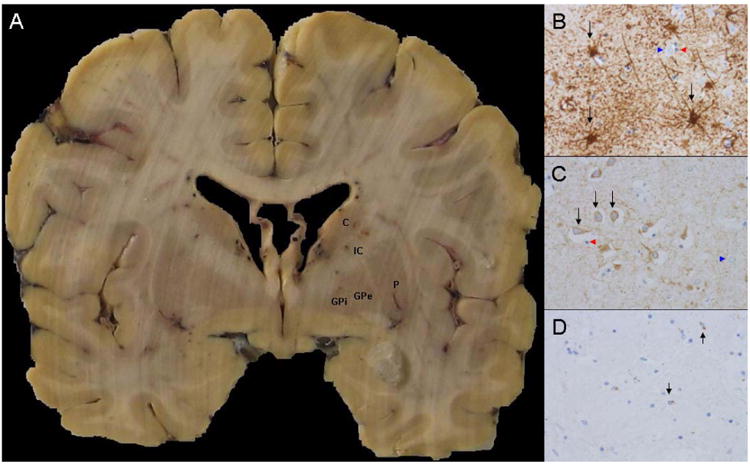
A, representative coronal section demonstrating the basal ganglia level where histological sampling was undertaken (C- Caudate, P-Putamen, IC- Internal capsule, GPe- Globus pallidus externa, GPi- Globus pallidus interna). B, representative high power (40×) GFAP-stained sections from an Mn exposed subject (black arrows demonstrate representative immunoreactive astrocytes, blue arrowheads show non-immunoreactive neurons, red arrowheads show non-immunoreactive oligodendrocytes). C, representative high power (40×) MAP2-stained sections from an Mn exposed subject, (black arrows demonstrate representative immunoreactive neurons, blue arrowheads show non-immunoreactive astrocytes, red arrowheads show non-immunoreactive oligodendrocytes). D, representative high power (40×) CD68-stained sections from an Mn exposed subject (black arrows demonstrate representative immunoreactive microglia).