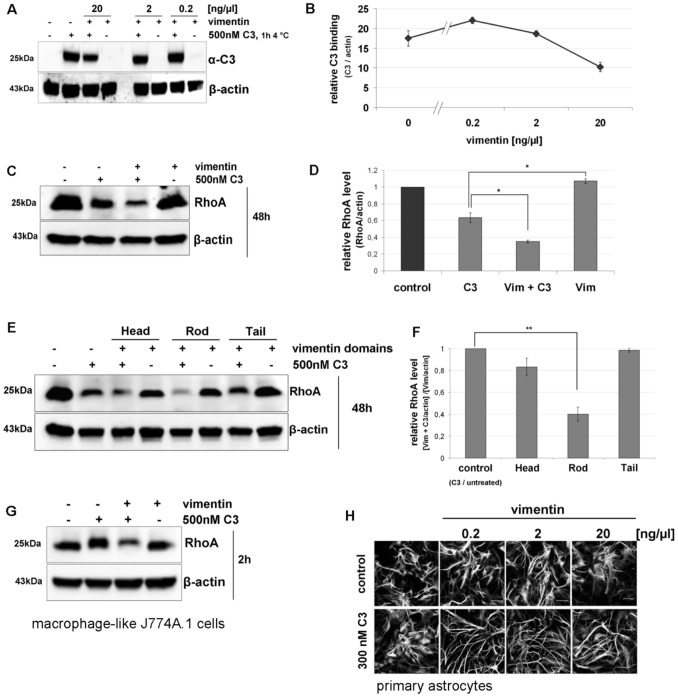
Figure 4. Binding and uptake of C3 in cultivated cells dependent on vimentin.
A) The Western blot shows the binding of C3 in presence and absence of extracellular added vimentin (n = 3 independent experiments). B) Densitometric evaluation of C3 (from A) and adjustment to the corresponding actin band are shown. C) The Western blot shows the degradation of RhoA as marker for C3 uptake and Rho-ADP-ribosylation. HT22 cells were treated with C3 (500 nM) alone or C3 (500 nM) plus vimentin (1 ng/µl) for 48 h. Cell lysates were submitted to Western blot analysis probing RhoA and β-actin. One representative Western blot experiment is shown (n = 3 independent experiments). D) Densitometric evaluation of RhoA (from C) and adjustment to the corresponding actin band are shown; the bars give the relative RhoA level. E) HT22 cells were incubated with C3 (500 nM) or C3 (500 nM) plus 1 ng/µl of either vimentin head-, rod- or tail-domain for 48 h. Cell lysates were submitted to Western blot analysis probing RhoA and β-actin. Decreased signal of RhoA reflects degradation of RhoA after ADP-ribosylation and thus, enhanced C3 uptake. One representative Western blot experiment is shown (n = 3 independent experiments). F) Densitometric evaluation of RhoA (from E) and adjustment to the corresponding actin band are shown; the bars give the relative RhoA level. G) J774A.1 macrophages were treated with C3 (500 nM) alone or C3 (500 nM) plus vimentin (1 ng/µl) for 2 h. Cell lysates were submitted to Western blot analysis probing RhoA and β-actin. One representative Western blot experiment is shown (n = 3 independent experiments). H) Primary astrocytes were exposed to C3 (300 nM) alone or a combination of C3 (300 nM) with different concentrations of vimentin (0.2, 2 and 20 ng/µl) for 6 h at 37°C. After incubation time the astrocytes were stained for the intermediate filament protein GFAP to visualize morphological changes.

