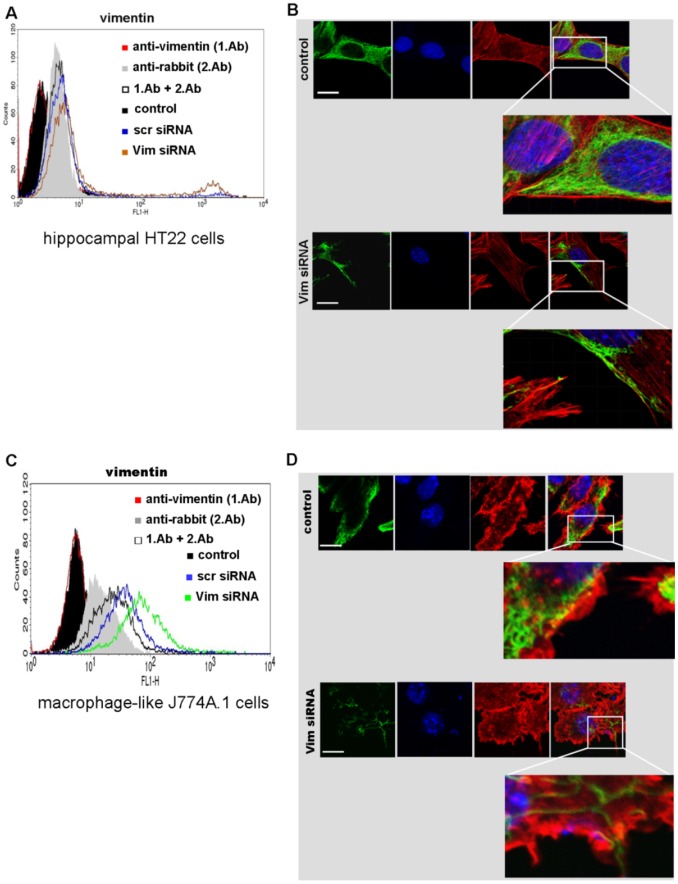
Figure 7. Analysis of vimentin distribution in analyzed cells.
A) Vimentin was detected by anti-vimentin at the cell surface of HT22 cells transfected with siRNA for 48 h at 37°C by FACS analysis. B) Confocal microscopy of vimentin in HT22 cells transfected for 48 h at 37°C. The green (oregon green 488) anti-vimentin, DNA staining in blue (Dapi), rhodamine red-staining for actin and a merge image are shown for each panel. In the enlarged images the cell boundaries are shown. Significant difference between the vimentin distribution was detected for the transfected cells (lower panel) in comparison to the control (upper panel). Scale bar = 20 µM. C) Detection of vimentin at the cell surface of J774A.1 cells transfected with siRNA. D) Confocal microscopy of vimentin distribution in J774A.1 cells transfected for 48 h.

