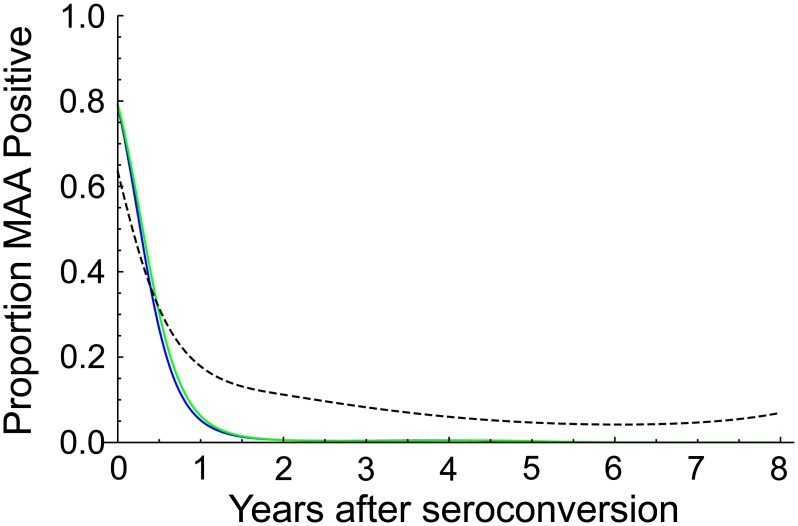
Figure 2. Proportion of samples classified as MAA positive as a function of the duration of HIV infection.
Probability curves are shown for the two MAAs described in Figure 1. A probability curve is also shown for the limiting antigen avidity assay (LAg-Avidity assay cutoff<1.5 OD-n) alone [10]. Key: blue line, MAA with the high resolution melting (HRM) diversity assay; green line, MAA with sequence ambiguity; dotted line, LAg-Avidity assay alone.

