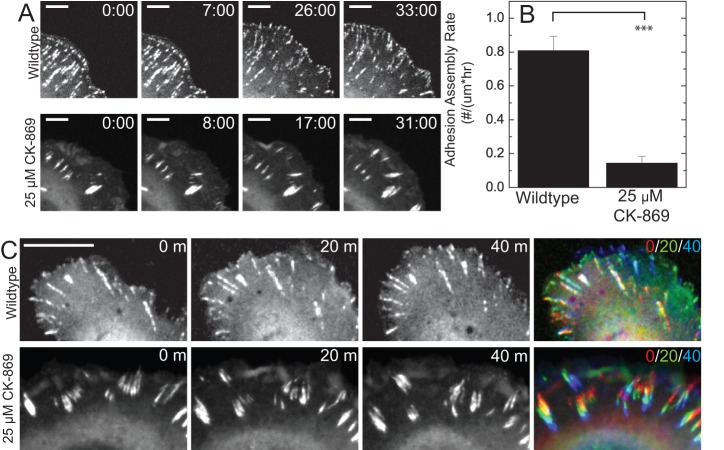
Figure 5. Arp2/3 inhibition impairs nascent adhesion assembly.
(A) Time-lapse images of paxillin visualized by expression of GFP-paxillin in normal cells and cells treated with 25 µM CK-869. Scale bar is 5 µm. Time indicated is min:sec (B) Plot of the adhesion assembly rate, measured as the number of new focal adhesions formed normalized by length of cell edge and total time of formation (n = 6 and 3 cells; error bars = SEM). ***, P<0.001 with respect to WT. (C) Time-lapse images of GFP-paxillin visualized by expression of GFP-paxillin in wildtype and 25 µM CK-869 cells. The color combined image represents the time series as a color progression from red to green to blue. Scale bar is 10 µm.

