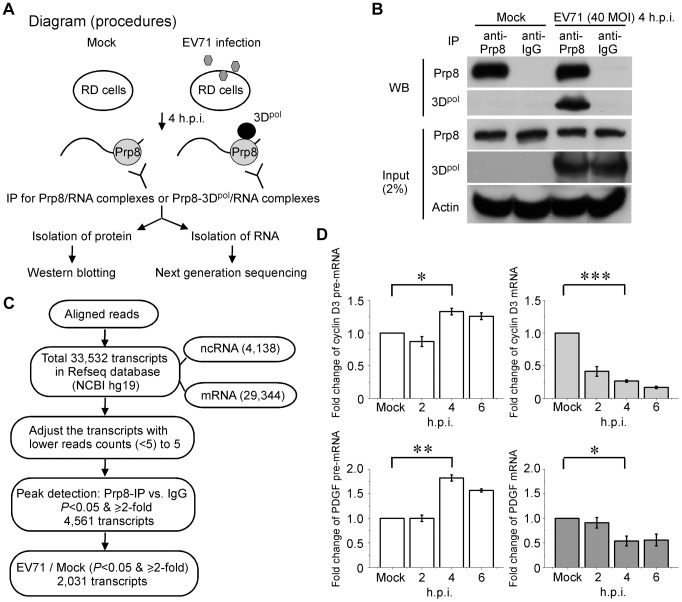
Figure 5. RIP-seq of the pre-mRNA trapped by the Prp8-3Dpol complexes.
(A) Procedural diagram for the RIP assays. The schematic shows the experimental procedure for characterizing RNA from Prp8 or Prp8-3Dpol complexes by IP. (B) The Prp8 antibody pulls down the Prp8 and Prp8-3Dpol complexes. In the WB analysis, the pulled down Prp8 and Prp8-3Dpol complexes demonstrated the efficiency of Prp8 IP and the interaction between Prp8 and 3Dpol. (C) A flow chart for the selection of targeted RNAs from the sequencing data. The schematic shows the experimental procedure for characterizing RNAs from Prp8 or Prp8-3Dpol complexes. (D) The inhibition of the pre-mRNA splicing in intracellular targeted cyclin D3 and PDGF. The increase in pre-mRNA and decrease in mRNA for intracellular cyclin D3 and PDGF in EV71-infected cells at 4–6 h.p.i. validated our RIP-Seq analysis. Error bars, mean ± SD (n = 3). The statistical significance was analyzed using a t test. ***p<0.001; **p<0.01; *p<0.05.

