
Figure 1. Heatmap representation of significantly deregulated miRNAs.
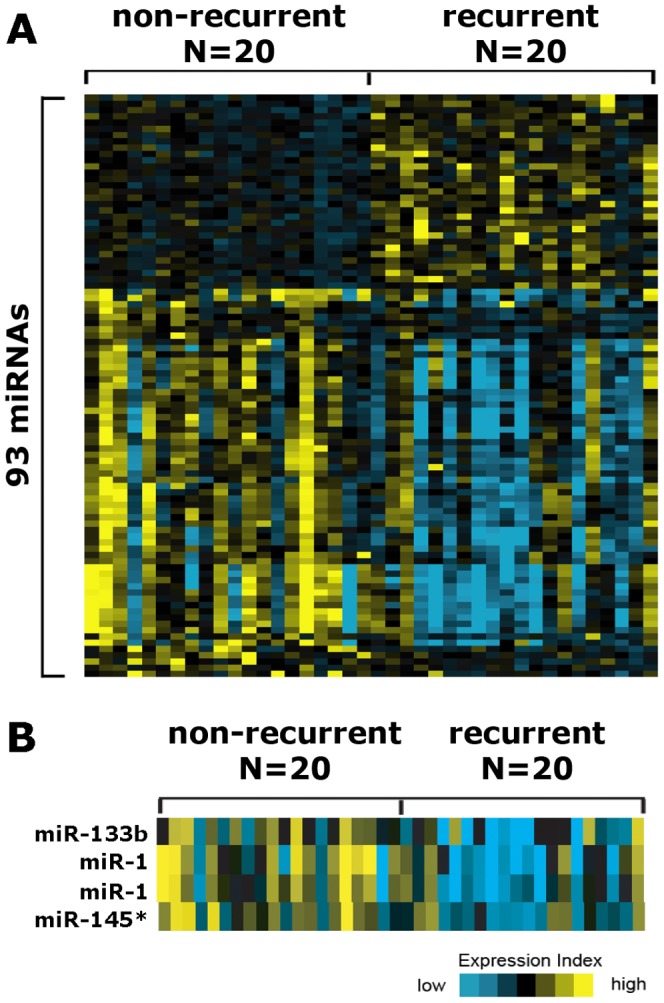
(A) Heat-map representation of significantly deregulated miRNAs in recurrent PCa specimens vs. non-recurrent PCa specimens. (B) Heat-map representation of miR-1, miR-133b and miR-145* in recurrent PCa specimens vs. non-recurrent PCa specimens.