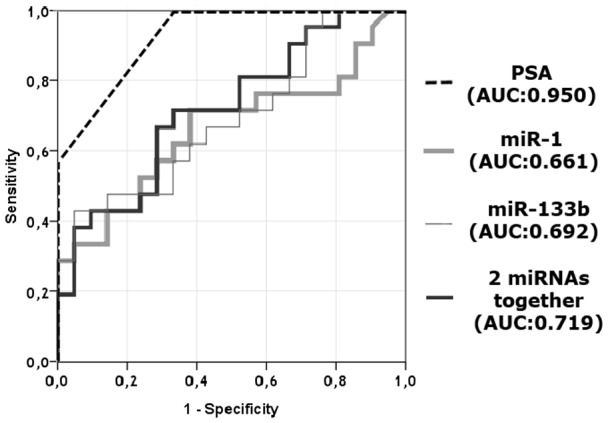
Figure 4. ROC analysis of miR-1 and miR-133b.

Curves for individual miRNAs and their cooperative power to discriminate two sets of patients comprised of 20 recurrent and 20 non-recurrent PCa specimens.

Curves for individual miRNAs and their cooperative power to discriminate two sets of patients comprised of 20 recurrent and 20 non-recurrent PCa specimens.