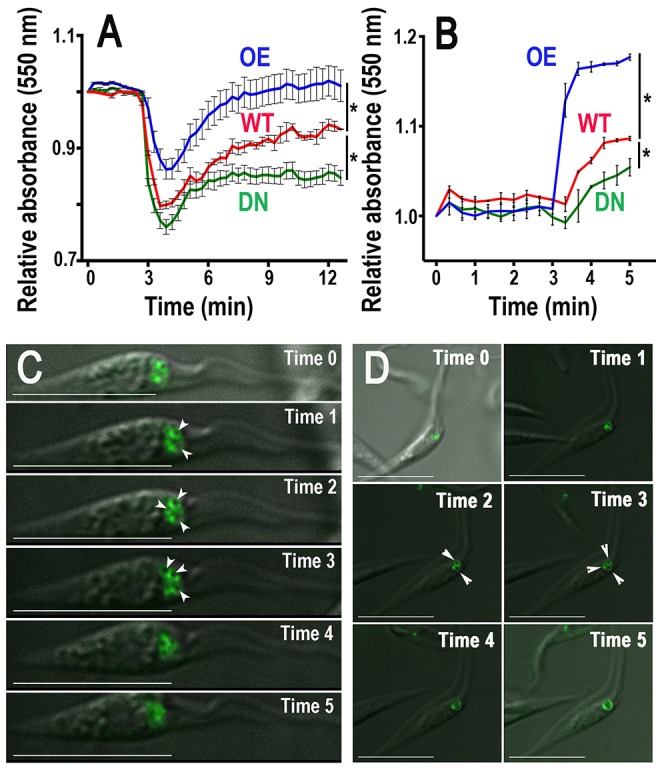
Figure 3. Regulatory volume changes of epimastigotes.

(A–B) Cells were pre-incubated in isosmotic buffer for 3 min and then subjected to hyposmotic (final osmolarity = 150 mOsm) (A) or hyperosmotic (final osmolarity = 650 mOsm) (B) stress. Relative change in cell volume was followed by monitoring absorbance at 550 nm by light scattering. As compared to wild-type cells (WT), cells expressing GFP-TcRab11DN (DN) failed to fully recover their volume after hyposmotic stress and shrank less after hyperosmotic stress, while cells overexpressing GFP-TcRab11 (OE) recovered their volume faster after hyposmotic stress and shrank more after hyperosmotic stress. Values are means ± SD of three different experiments. Asterisks indicate statistically significant differences, p<0.05, (Bonferroni's multiple comparison “a posteriori” test of one-way ANOVA) at all time points after induction of osmotic stress. (C–D) Epimastigotes were immobilized on glass slides with poly-lysine and diluted with deionized water to a final osmolarity of 150 mOsm (C) or bathed with hyperosmotic (650 mOsm) buffer (D). Video microscopy data were collected and selected frames are shown. Times indicated in each frame represent 1 second apart after induction of stress. Arrowheads show different dilated compartments that transform into larger bladders at a later time. Results are representative of those obtained from at least three independent experiments. Bars = 10 µm.
