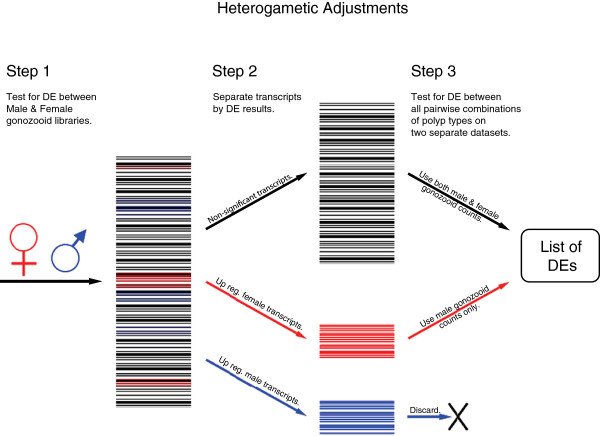
Figure 7.

Diagram illustrating approach taken for adjusting for gametic expression. DE analysis was conducted between male and female gonozooid libraries (step 1), identifying significantly up- or down-regulated transcripts (step 2). Those transcripts found to be significant were excluded from the template pool and a DE analysis on those non-significant transcripts included counts from both male and female libraries (step 3 shown in black). Then, a second DE analysis was conducted on transcripts up-regulated in female gonozooids. For these comparisons, only the expression counts from male gonozooids libraries were used (step 3 shown in red). Results from the both analyses (step 3) were combined.
