
Figure 1.
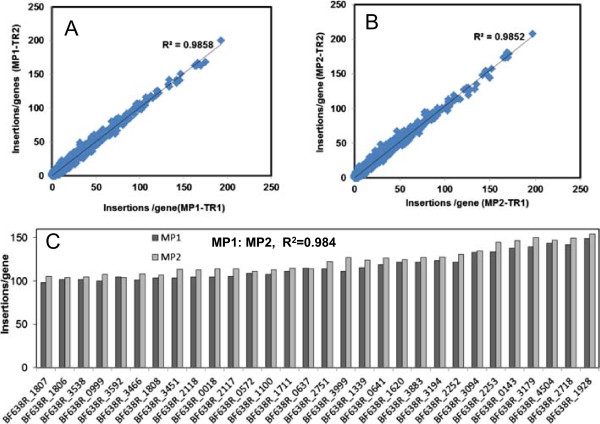
Reproducibility of transposon mutant library. The number of unique transposon insertions/gene between technical replicates of the mutant population 1 (MP1) (A) and 2 (MP2) (B). Each point represents the number of unique insertions in the specific gene present in two technical replicates. C. Reproducibility between biological replicates. The number of unique insertions/gene in two technical replicates are averaged and then compared between biological replicates. Only genes with 100-147 unique insertions/gene are displayed. The R2 between MP1 and MP2 is 0.984.