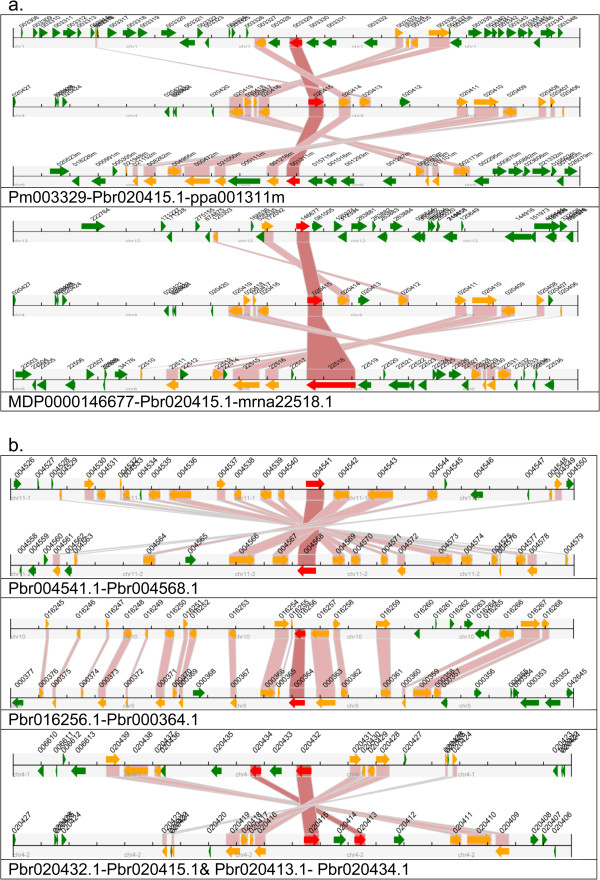
Figure 4.

Collinearity relationships of LOX genes in pear. A region of 100 kb on each side flanking the LOX genes (the red one) is shown in this figure. Homologous gene pairs are connected with bands. The genes on the scaffold are not included. The black horizontal scale line represents the chromosome segment with the chromosome name under the line, and the broad line with arrowhead represents genes and its transcriptional orientation. The gene names suffix is the text besides the line. The LOX genes are shown in red, homologous genes are shown in yellow and other genes shown in green. Pbr- denotes a pear gene, MDP- apple, ppa- peach, Pm- Mei and mrna- strawberry. a. The example of Pbr020415.1 to show the synteny relationship among different species. b. The collinearity relationships of LOX genes in pear.
