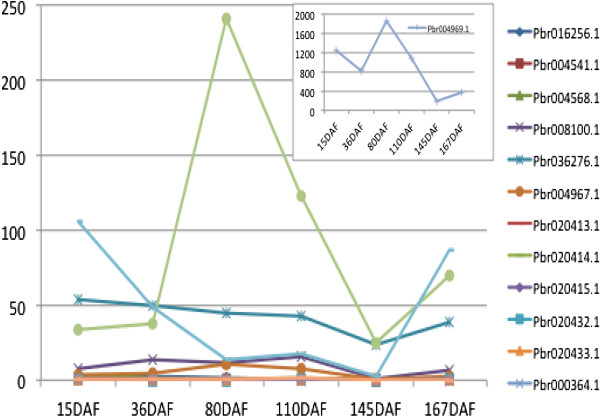
Figure 5.

Expression level of LOX genes in pear fruit. The value on the y-axis is the RPKM (reads per kilobase per million) value for each gene. The x-axis represents the six stages of pear fruit development, 15 days after flowering (DAF), 36 DAF, 80 DAF, 110 DAF, 145 DAF, and 167DAF.
