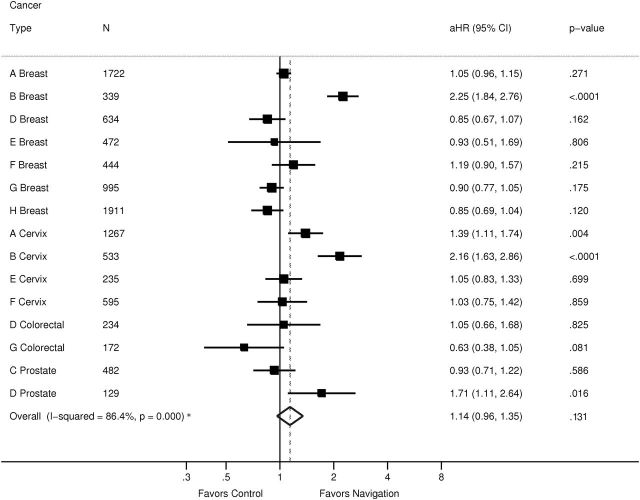
Figure 2.
Meta-analysis of impact of patient navigation on diagnostic resolution after cancer screening abnormality from 0 to 90 days: Patient Navigation Research Program. I 2 addresses the heterogeneity of the model and is not the overall effect of the intervention. The solid vertical line denotes 1, or no effect. The squares denote the adjusted hazard ratio for each center and cancer type, with the horizontal line indicating the 95% confidence interval. The dotted vertical line denotes the adjusted hazard ratio for the meta-analysis. The diamond indicates the 95% confidence interval of the adjusted hazard ratio. The letters (A–H) in the first column denote the study center. aHR = adjusted hazard ratio; CI = confidence interval.

