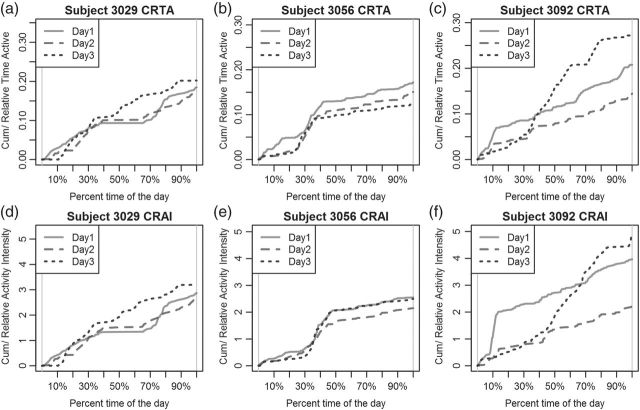
Figure 4.
Top panels: CRTA for Subject 3029 (a), 3056 (b), and 3092 (c). Bottom panels: CRAI for Subjects 3029 (d), 3056 (e), and 3092 (f). There are three curves in each plot, each representing 1 day. These curves are either compressed or stretched so that they display CRTA or CRAI in the scale of percentage time of the day, instead of actual time.

