
Fig. 1.
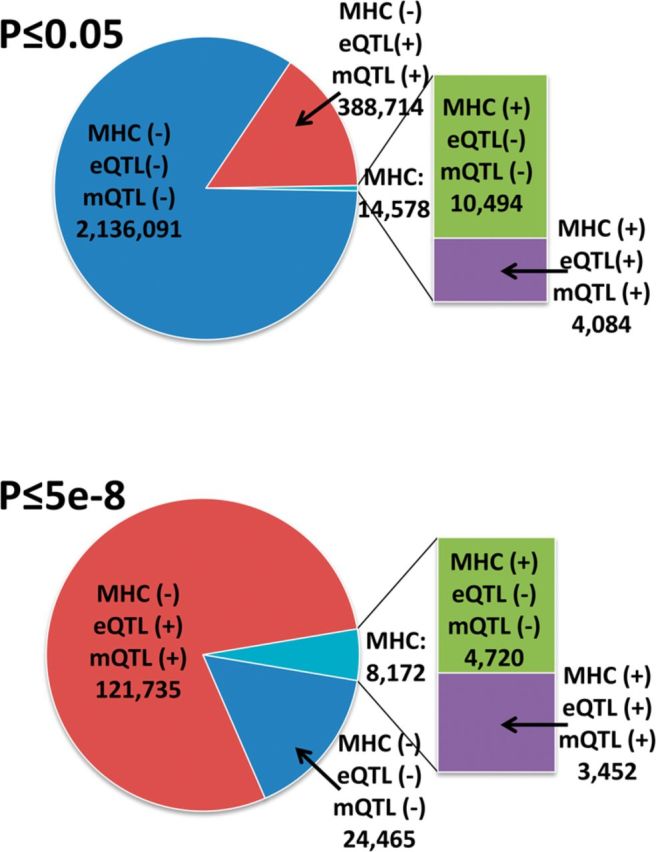
Proportion of unique SNPs with associations at two thresholds [P ≤ 0.05 (top panel), P ≤ 5E − 8 (bottom panel)] either in, or outside of the MHC class-II region (6p21.3), and/or in, or not in, studies of high phenotype number (eQTL, methylation QTL and metabolomics QTL studies)