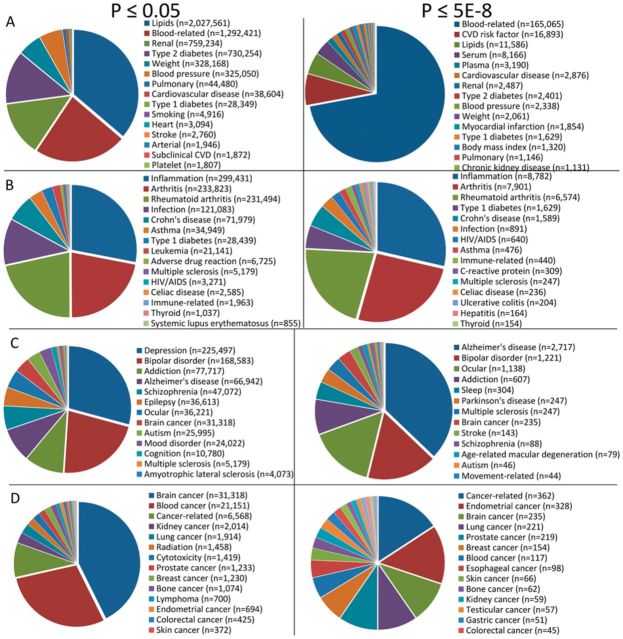
Fig. 2.
Pie chart breakdowns of number of results in GRASP by phenotype categories at two statistical threshold (left pies: P ≤ 0.05, right pies: P ≤ 5E − 8). Major categories are cardiovascular traits and risk factors (row A), immunological traits and disorders (row B), neurological traits (row C) and cancer traits (row D)

