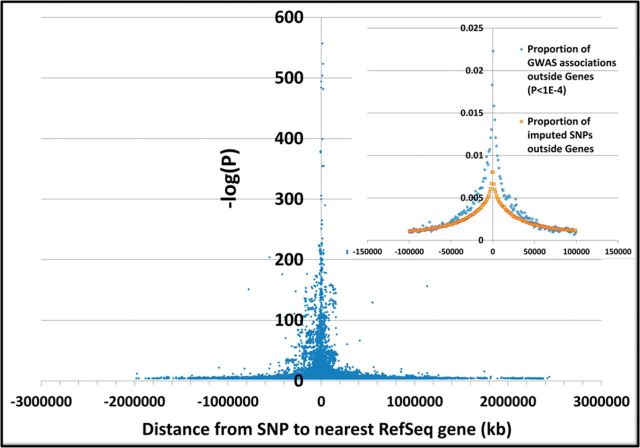
Fig. 4.
GWAS strength of association (blue points) relative to distance to nearest gene for SNPs with P < 1E − 4 and located outside of RefSeq gene transcript isoform boundaries only. eQTL and mQTL and MHC 6p21.3 results are excluded. The inset (upper right) shows enrichment of the proportion of GWAS associations within ∼50 kb of genes (light blue) relative to the proportion of HapMap European imputed SNPs in FHS (yellow)

