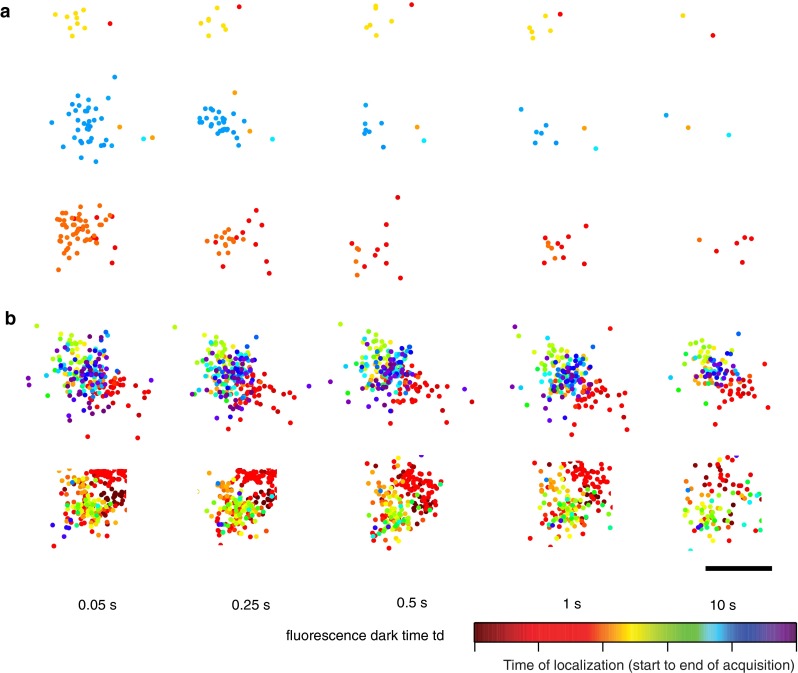
Fig. 2.

Snapshots of clusters formed by localizations of membrane proteins in fixed HeLa cells. Markers represent single-molecule localizations and their color represents the time of localization. a Representative images of three artifact spatial-temporal clusters of SrcN15-mEos2 (a negative control for clustering) and their evolution for increasing values of the allowed fluorescence dark time threshold t d. b Representative images of two β2-mEos2 clusters and their evolution with the fluorescence dark time threshold t d. A temporal artifact component (red sub-cluster) is also visible in the second cluster. The estimated location of the molecules changes slightly from one t d value to another since the number of collected photons and their spatial distribution attributed to each localized molecule changes. Scale 100 nm. Taken from Annibale et al. 2011
