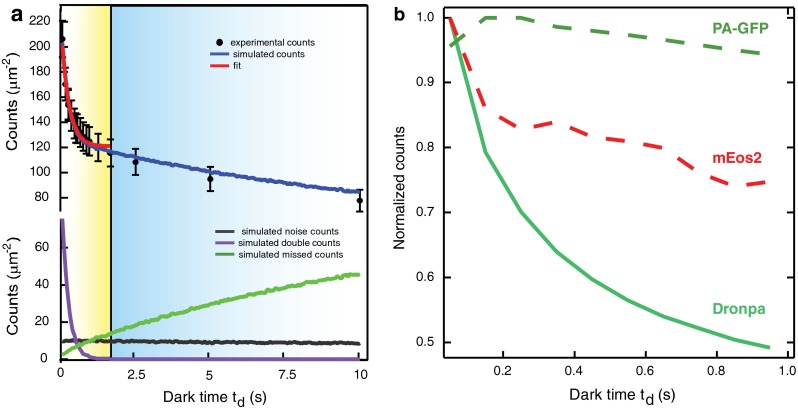
Fig. 3.

a The experimental (markers) and simulated (blue curve) counts of mEos2 molecules localized as a function of the dark time threshold t d, together with the simulated counts ascribed to missed counts (green), multiple counts (violet), and noise (black). For all samples, the duration of the acquisition is 20,000 frames × 50 ms. The red curve shows the best fit to the data for t d values between 0.05 and 2 s. If no missed counts were to occur, the asymptote of the decaying curve of the observed counts would converge to the effective number of molecules present in the sample. Fitting to a negative exponential model yielded a mean of t off = 0.260 s and a mean of n blink = 0.760, consistent with what was shown in Fig. 1d and e respectively. The fit yielded N = 121 ± 6 molecules/µm2, whereas the total density of the simulated sample was 135 molecules/µm2 including noise counts, resulting in a 10 % error. Taken from Annibale et al. 2011. b Comparison of the normalized estimates for counts of localized molecules as a function of t d, for three different fluorescent proteins: paGFP, Dronpa and mEos2. Taken from Annibale et al. 2011
