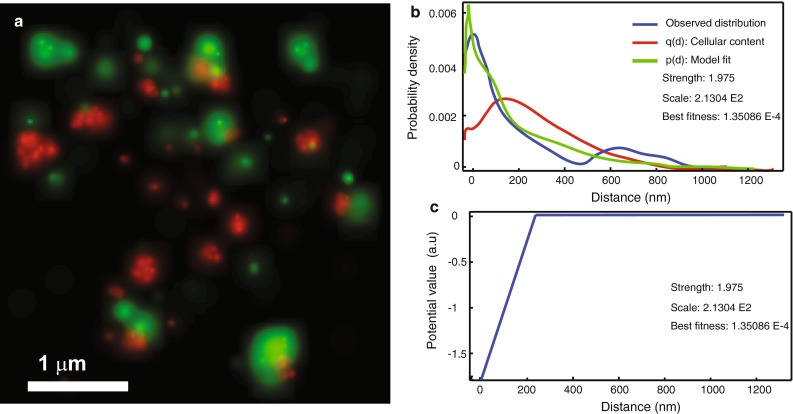
Fig. 5.

Spatial interaction analysis of dual-color PALM images. The method uses a nearest neighbor spatial interaction model based on Gibbs statistics, which characterizes an interaction by means of a potential (Helmuth et al. 2010). a Dual-color PALM data represented as probability maps. The green channel shows the GPCR protein β2-adrenergic receptor labeled with psCFP2, and the red channel shows clathrin light chain labeled with pamCherry (Annibale 2012; Annibale et al. 2012). b Results of interaction analysis: the observed nearest neighbor distance distribution between the two channels (blue); the result of fitting the spatial interaction model with a linear L1 potential to this distribution (green); the curve corresponding to the null hypothesis of “no interaction”, estimated by accounting for the intra-point pattern distance distribution (red). The method also returns the inferred parameters (i.e., strength and scale) that can be used for comparison. c The inferred interaction potential. Adapted from Shivanandan et al. 2013
