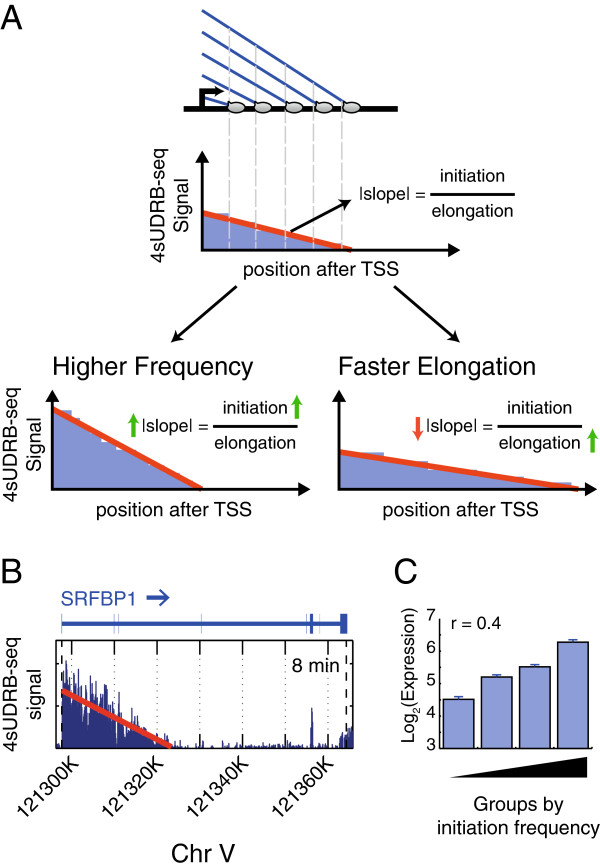
Figure 4.

Calculation of genomewide relative transcription initiation frequencies by 4sUDRB-seq. (A) Schematic representation of the linear decrease in 4sUDRB-seq read intensity downstream to the TSS of a hypothetical gene and in a gene with similar elongation rate but higher initiation frequency (“Higher Frequency”) or in a gene with similar initiation frequency but faster elongation rate (“Faster Elongation”). (B) Analysis as in (A), exemplified for the 8 min time point of the SRFBP1 gene, Red: linear fit of the signal upstream to the boundary found by our algorithm. (C) Average expression levels of four quartiles of genes binned by increasing initiation frequencies. r indicates Pearson correlation. Error bars = standard errors.
