
Figure 3.
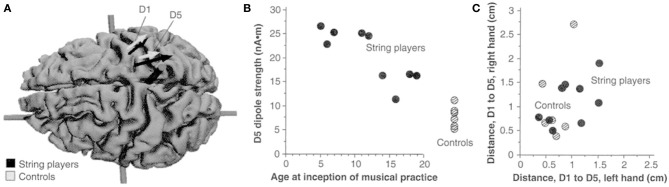
(A) Equivalent current dipoles elicited by stimulation of the thumb (D1) and fifth finger (D5) of the left hand are superimposed onto an MRI (magnetic resonance imaging) reconstruction of the cerebral cortex of a control, who was selected to provide anatomical landmarks for the interpretation of the MEG-based localization. The arrows represent the location and orientation of the ECD vector for each of the two digits' averaged across musicians (black) and controls (shaded). The length of the arrows represents the mean magnitude of the dipole moment for the two digits in each group. The average locations of D5 and Dl are shifted medially for the string players compared to controls; the shift is larger for D5 than for Dl. The dipole moment is also larger for the musicians' D5, as indicated by the greater magnitude of the upper arrow. (B) The magnitude of the dipole moment as a function of the age of inception of musical practice; string players are indicated by filled circles, control subjects by hatched circles. Note the larger dipole moment for individuals beginning musical practice before the age of 12. (C) Scatterplot of the Euclidean distances (in centimeters) between the cortical representations of Dl and D5. This distance for the musicians' left hands was greater than that in controls, but this difference is not statistically significant. Reprinted from Elbert et al. (1995).