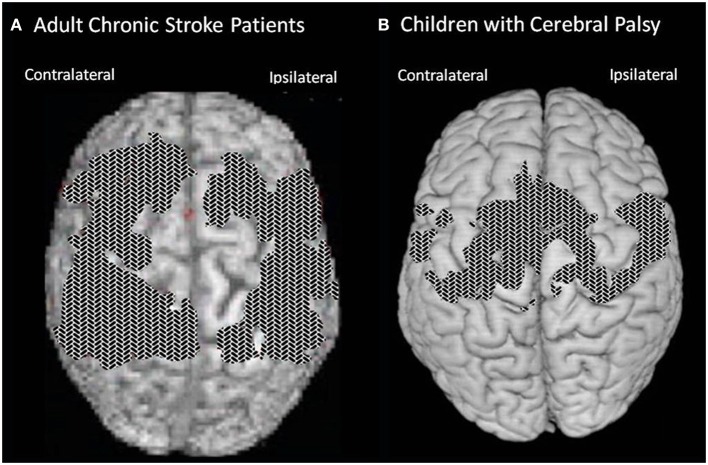
Figure 5.
Cortical surface-rendered image of gray matter change after CI therapy in (A) adults with chronic stroke and (B) children with hemiparetic cerebral palsy. Gray matter increases displayed on a standard brain. Surface rendering was performed with a depth of 20 mm. Cross-hatched areas indicate t statistics ranging from 2.0 to 6.7. Corrected for family-wise error.

