Figure 2.

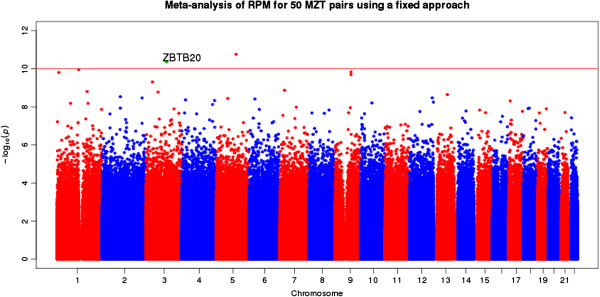
Manhattan plot showing the P- values of approximately 10 M 500 bp bins from the meta analysis with the ZBTB20 DMR identified in the plot.

Manhattan plot showing the P- values of approximately 10 M 500 bp bins from the meta analysis with the ZBTB20 DMR identified in the plot.