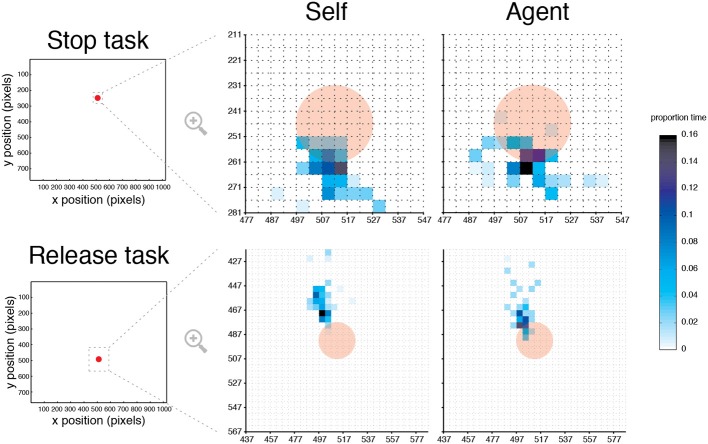
Figure 6.
Eye gaze position in Self and Agent conditions. Heat maps illustrating the mean fixation time as a percentage of block duration for a typical participant in the Stop and Release tasks, superimposed on the target (opaque red). For illustration, an area of interest was selected so at to capture at least 98% of fixation duration data. For each task, this area was then “down-sampled” to 5 × 5 pixels datasets, where the color in each data point indicates the percentage of fixation duration.

