
Figure 4. Functional classification of differentially expressed genes in both conditions.
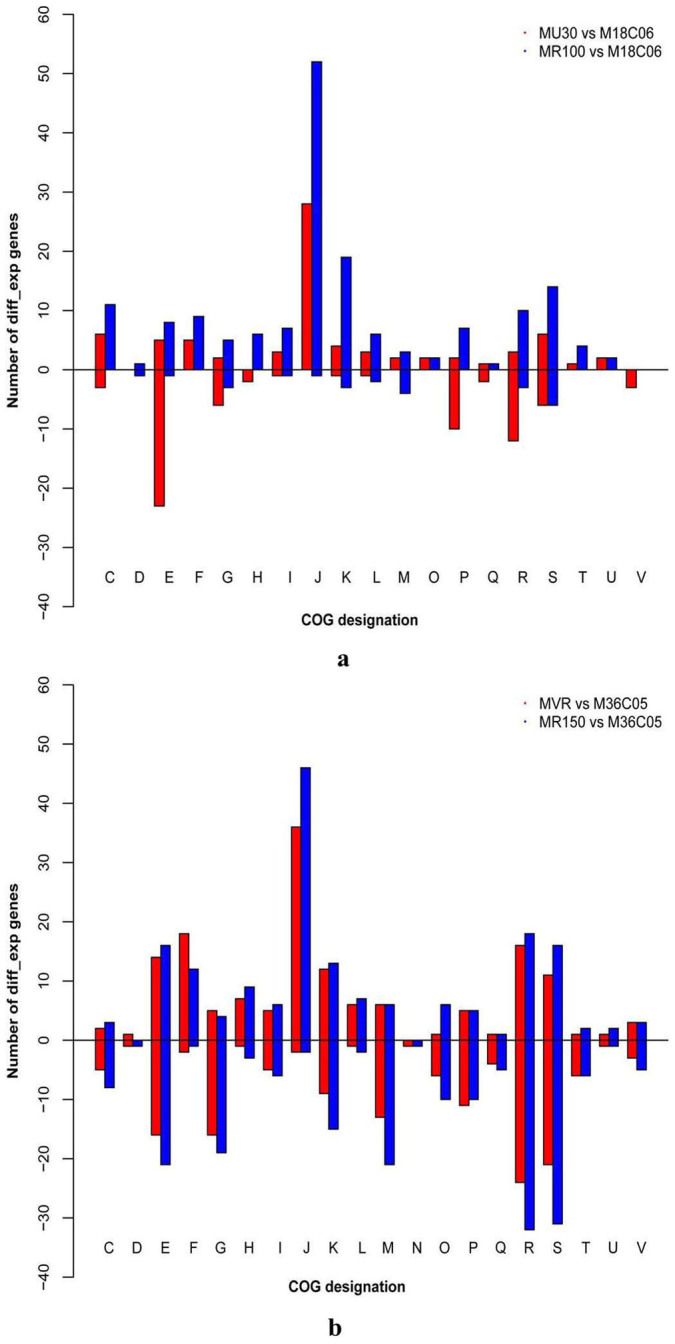
Profiles of the functional classes are shown as the number of differentially expressed genes in each condition. a) Inhibitory condition, and (b) removed condition. Clusters of orthologous gene designations are described in Supplementary Table S12 online.