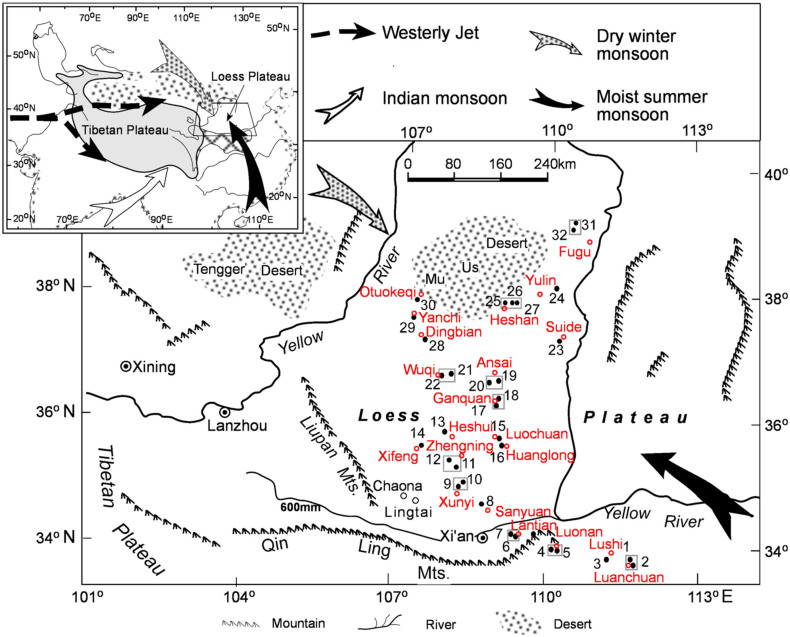
Figure 1. Schematic map of the Chinese Loess Plateau and the location of the Chaona section (black circle), the Lingtai section (black circle), surface soil samples (solid dots) and meteorological stations (red circle) used in this paper.
The inset illustrates the location of the Chinese Loess Plateau relative to the Tibetan Plateau and modern Asian atmospheric circulation. Magnetic parameter values were averaged for dots within the gray rectangle before comparing with the meteorological data closest to them. Revised from Song et al. (2007)54.

