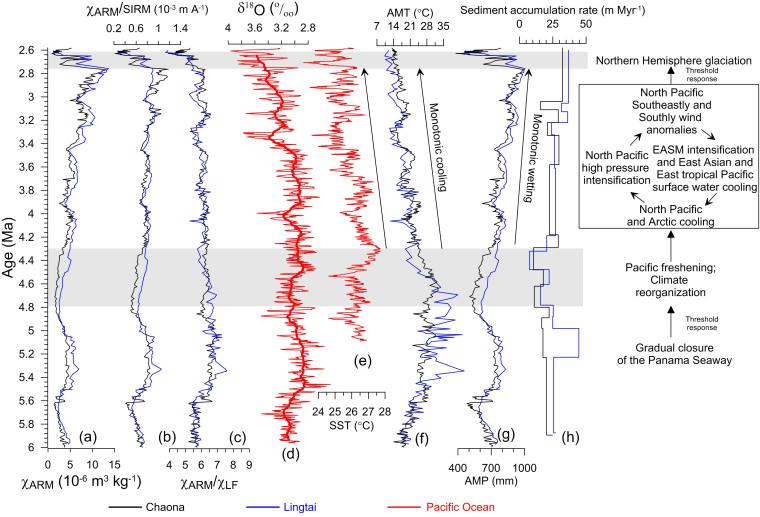
Figure 3. Paleoclimatic and paleoceanographic data for the time interval 6–2.6 Ma.
(a), (b), (c), the Chaona (black) and Lingtai (blue) χARM, χARM/SIRM and χARM/χLF records, respectively. (d), (e), East Equatorial Pacific Ocean Drilling Project (ODP) site 846 benthic oxygen isotope26 and sea surface temperature6 records respectively. (f), (g), reconstructed Chaona (black) and Lingtai (blue) annual mean temperature (AMT) and annual mean precipitation (AMP) records based on the correlation regression fits in Figs. 2f and 2h respectively. (h), Chaona (black) and Lingtai (blue) sedimentation rate records. For the interval 3.6–2.6 Ma, the Chaona and Lingtai age models were tuned to the monsoon stack55; for the interval 6–3.6 Ma, the age models of the two sites are based on paleomagnetic dating9,25. EASM: East Asian summer monsoon.

