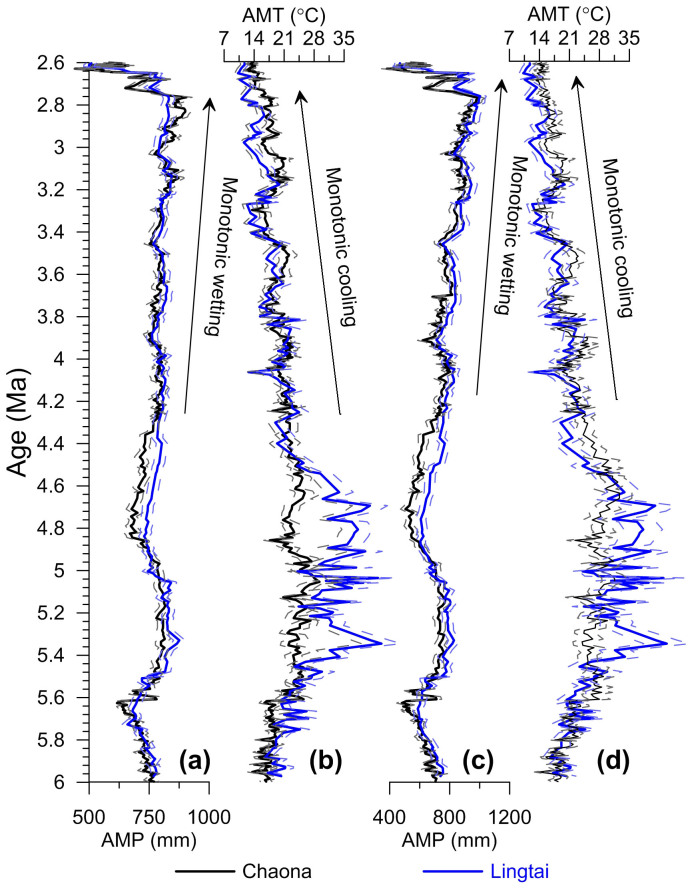
Figure 4. A comparison of reconstructed annual mean precipitation (AMP) and annual mean temperature (AMT).
(a), AMP based on the empirical relationship in Fig. 2d; (b), AMT based on the empirical relationships in Figs. 2d and 2h; (c), AMP based on the empirical relationship in Fig. 2f; (d), AMT based on the empirical relationships in Figs. 2f and 2h. We note that the AMT and AMP records based on two methods have similar trends. The dashed line represents the 2 σ uncertainty (standard error) of each record. The uncertainties in the paleo data were propagated from the uncertainties of surface soils in Fig. 2.

