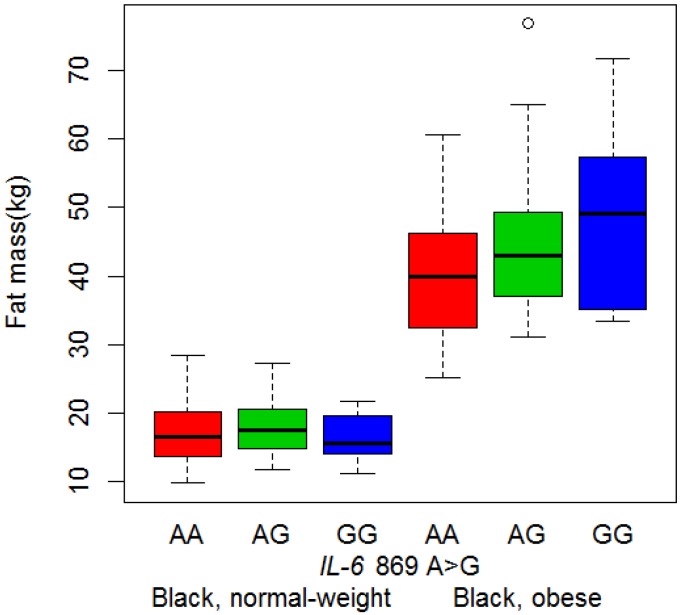
Figure 2.
Interaction between IL-6 IVS4 +869 A>G polymorphism and BMI group on fat mass in black women. Figure contains boxplots of fat mass in black women, separated by BMI group and genotype. Boxplots indicate the median, the quartiles and the minimum and maximum values for each group. Abbreviations: BMI, body mass index; IL-6, Interleukin-6.

