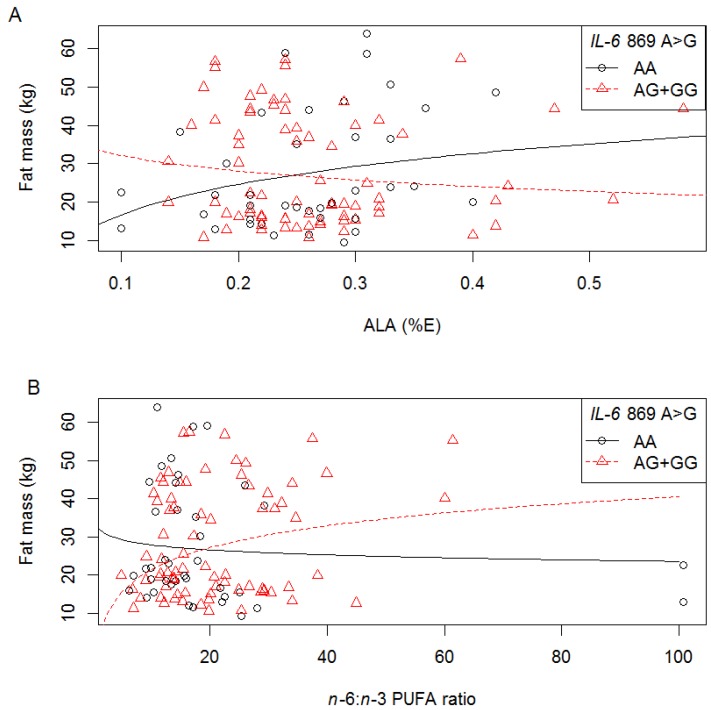
Figure 6.
The relationship between fat mass, IL-6 IVS4 +869 A>G polymorphism and dietary fat intake in white women. Symbols represent, for each woman, observed values. The lines are modeled relationships for a woman of average age (27.3 years). (A) With increasing ALA intake (%E), fat mass decreased in those with the IVS4 +869 AG or GG genotype (R2 = 0.13, p = 0.048); (B) With increasing n-6:n-3 PUFA ratio, fat mass increased in those with the IVS4 +869 AG or GG genotype; compared to those with the AA genotype (R2 = 0.15, p = 0.034).

