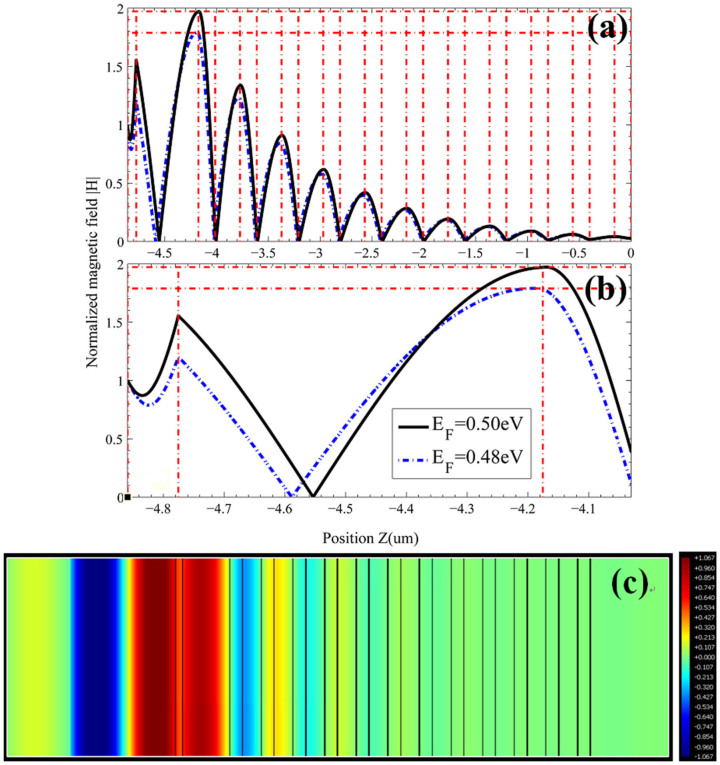
Figure 4. The magnetic field distributions in the critically coupled resonance at different Fermi energy EF, (b) is the enlarged view of (a) in the graphene-based HMMs and spacer, (c) is the magnetic field distributions gotten by FDTD method for EF = 0.50 eV and λ = 1.534 um.
EF = 0.50 eV and λ = 1.534 um, and EF = 0.48 eV and λ = 1.594 um are for the solid-line and dashed-dotted line, respectively. Other parameters are as in Fig. 2, the red dashed-dotted lines in (a) and (b) and solid-line in (c) show the interface of different materials.

