
Figure 1.
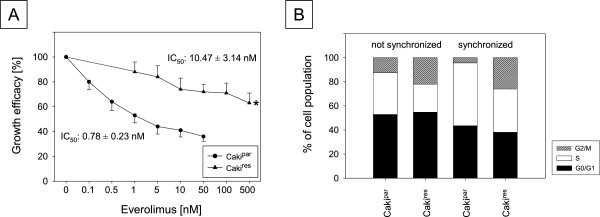
Dose response analysis of Cakipar and Cakires. (A) Growth efficacy of increasing concentrations of everolimus on Cakipar and Cakires cell growth from 24 h to 72 h. *Indicates significant difference to controls, set to 100% (SD ≤ 16%, n = 6). IC50-values of Cakipar and Cakires cells were calculated from dose response analysis. (B) Cell cycle analysis of unsynchronized and synchronized Cakipar and Cakires cells in subconfluent cell cultures. The cell phase is expressed as percentage of total cells. The figure shows one of five separate experiments.