
Figure 2.
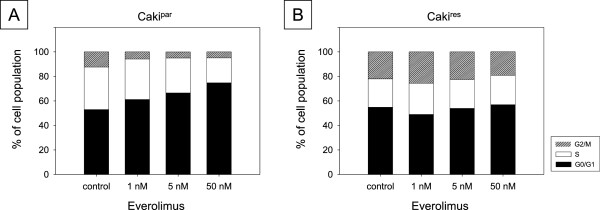
Cell cycle analysis of Cakipar (A) and Cakires (B) after 24 h exposure to 1, 5 and 50 nM everolimus in subconfluent cell cultures. The cell population is expressed as percentage of the total cells analyzed. Untreated cells served as controls. One representative experiment of six is shown.