
Figure 4.
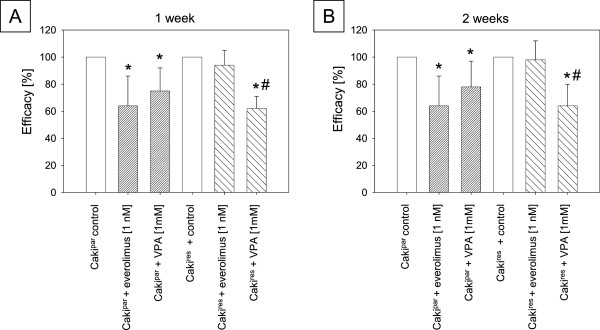
Cell growth analysis. Growth inhibitory efficacy of 1 nM or 1 mM VPA in Cakipar and Cakires cells treated for one (A) or two weeks (B). *Indicates significant difference to untreated controls, set at 100%. #Indicates significant difference between Cakipar + VPA and Cakires + VPA (SD ≤ 22%, n = 6).