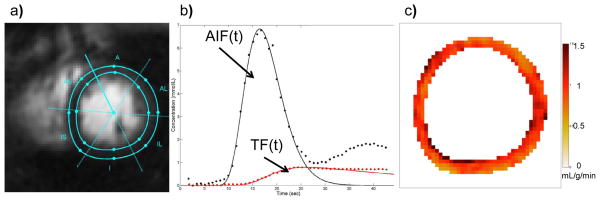
Figure 1. Absolute Quantification of Perfusion using Fermi-function deconvolution from a dual-sequence spiral trajectory acquisition.
(a) The myocardium is segmented to generate time intensity curves for the myocardial tissue function (TF). (b) The signal intensity is converted into concentration of gadolinium for both the arterial input function (AIF) and tissue function prior to deconvolution. (c) a pixel-by-pixel perfusion map shows uniform perfusion of 1mL/g-min in this normal volunteer.

