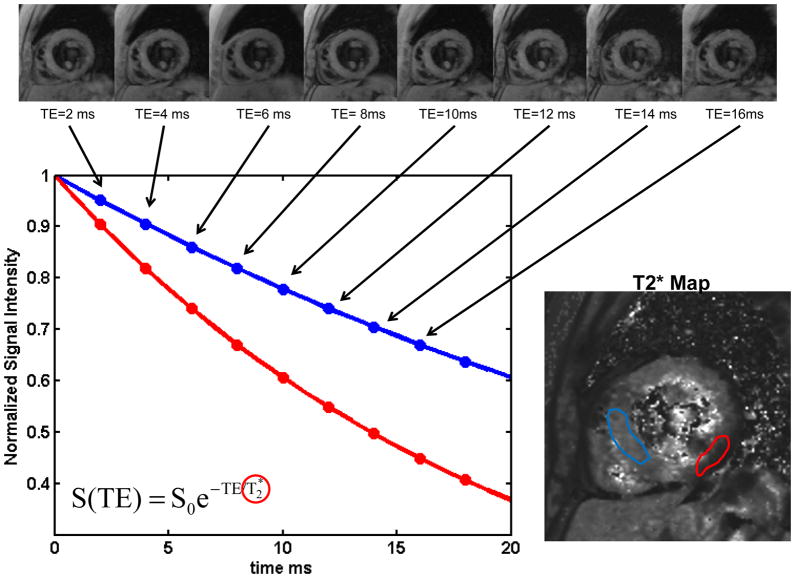
Figure 4. Calculation of T2* maps in a normal subject.
(a) A set of gradient echo images acquired with different echo times (TE) from 2ms to 18 ms are acquired. As the TE is increased the signal intensity decreases due to static field inhomogeneities resulting in T2* decay. (b) The data from each pixel is fit to a T2* decay curve. Pixels with longer T2* decay more slowly (red curve) as compared to regions with shorter T2* blue curve). (c) the T2* map shows a region of reduced T2* in the inferolateral wall which is caused by susceptibility artifact and can be seen even in normal subjects.

