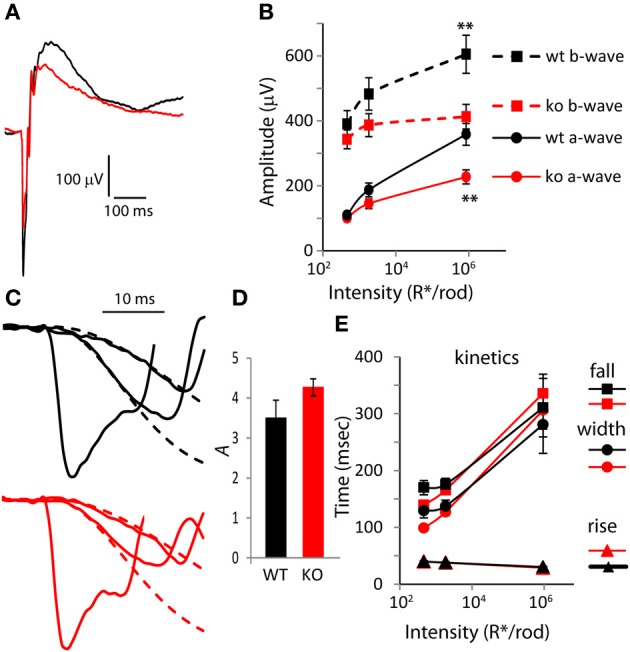
Figure 2.

The amplitude of the a-wave is smaller in PDE9A KO but its kinetics is largely unaffected. (A) Average response from WT and KO retinas to a rod saturating flash (~106 R*/rod). (B) Average a-wave and b-wave amplitudes (dark-adapted, rod and cone generated responses). Both a-wave and b-wave amplitudes in KO (n = 14 mice for all intensities) are significantly different from WT (n = 12) at the two highest intensities. Unless otherwise stated, for all figures, “*” designates p < 0.05 and **p < 0.01. (C) Expanded ERG responses from a KO and WT animal at the flash intensities in (B) showing the a-waves and their Lamb and Pugh curve fits (red and black dashed lines for KO and WT, respectively). The Lamb and Pugh equation was fit to the average a-wave from both eyes of the animal to estimate the amplification constant. (D) The Lamb and Pugh amplification constants as estimated by regression in WT and KO animals are similar. (E) The time taken by the b-wave to rise and fall to 66% of its amplitude and the duration (width). For the highest intensity, the b-wave fell to 66% of its amplitude only in 50% of WT and in 82% of KO.
