
. 2014 Jun;4(1):010406. doi: 10.7189/jogh.04.010406
Copyright © 2014 by the Journal of Global Health. All rights reserved.
This is an open access article distributed under the Creative Commons Attribution License, which permits unrestricted non-commercial use, distribution, and reproduction in any medium, provided the original work is properly cited.
Figure 3.
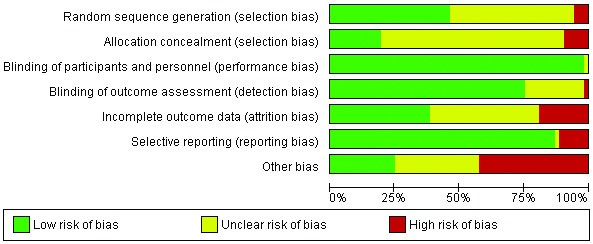
Overall risk of bias graph.