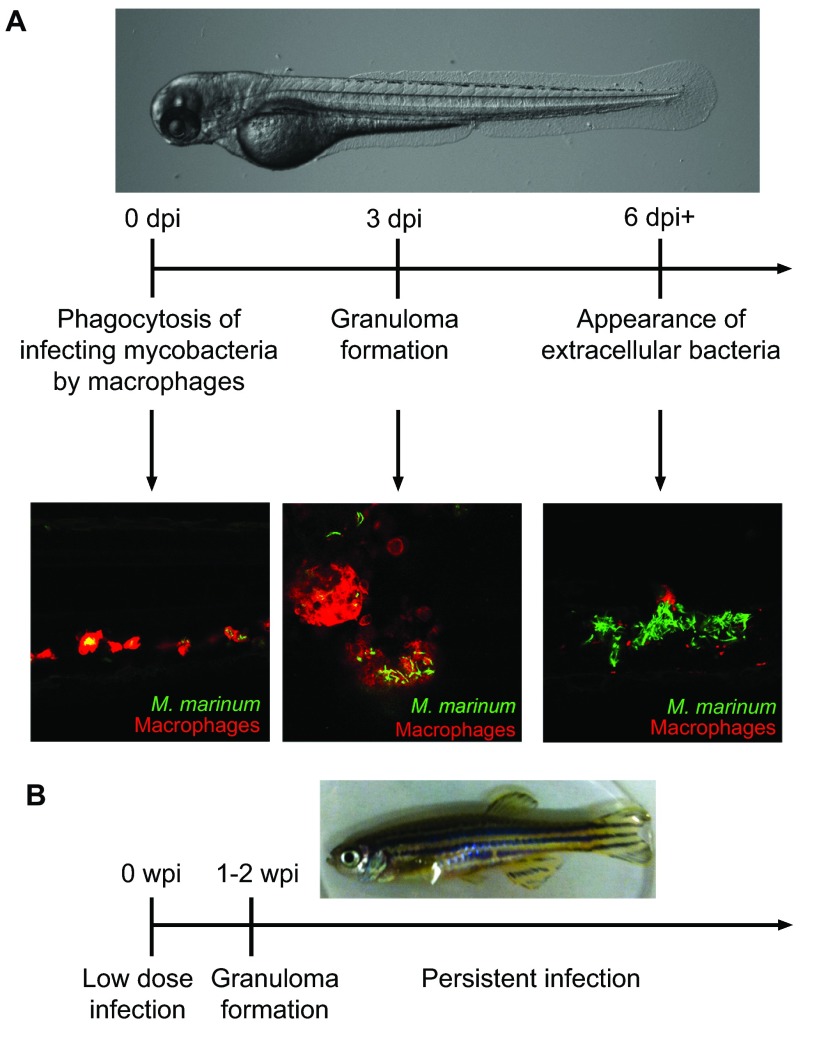
Fig. 1.
Modeling mycobacterial infection in larval and adult zebrafish. (A) From top – brightfield image of a zebrafish larva. Middle – an approximate timeline of progression of infection in zebrafish larvae, in days post-infection (dpi). Bottom – confocal images of zebrafish lines, with fluorescently labeled macrophages shown in red and infecting fluorescent mycobacteria visualized in green. Representative images display from left – scattered infected macrophages; center – macrophages aggregated into granulomas; right – the appearance of extracellular bacteria as containment fails at isolated granulomas. (B) Top – image of an adult zebrafish. Bottom – a timeline of infection progression in weeks post-infection (wpi) in the adult persistent infection model (based on the work of Parikka et al., 2012).

