
Fig. 2.
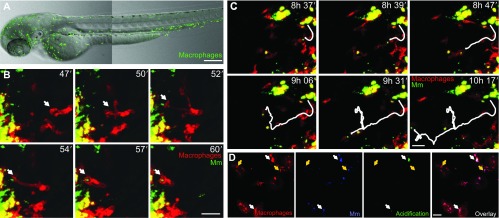
In vivo imaging of macrophage responses to infection. (A) A 3-dpf Tg(mpeg1:Gal4-VP16/UAS-E1b:Kaede) zebrafish embryo showing the distribution pattern of macrophages (green). Random patrolling of macrophages is shown in supplementary material Movie 1. (B) Phagocytosis of M. marinum (Mm; green) injected into the subcutaneous area overlying a somite in a 2-dpf Tg(mpeg1:mCherry-F) embryo. The arrow points at a macrophage (red) in the process of phagocytosis between 47 and 60 minutes post-infection. The images are particulars and stills from supplementary material Movie 2 (10 to 60 minutes post-infection). (C) Macrophage-mediated dissemination of M. marinum infection. The white track represents the path of an infected macrophage migrating away from the infection focus. The images are stills and particulars from supplementary material Movie 3, which was taken from the same embryo as in B at a more advanced stage of infection (~8 to ~10 hours post-infection). (D) Partial acidification of phagocytosed M. marinum. Bacteria double-labeled with constitutive mCrimson and pH-sensitive green pHrodo are contained within subcellular compartments of macrophages, which are intensely labeled by the membrane-bound mCherry of the Tg(mpeg1:mCherry-F) line. White arrows point at bacteria in acidified compartments, where the pHrodo dye is activated. Yellow arrows point at bacteria in non-acidified compartments. Note that most of the intracellular mycobacteria are not acidified, consistent with the ability of this pathogen to counteract phagosome maturation. Macrophages were imaged in the yolk sac circulation valley 5 hours after injection of bacteria into the caudal vein at 2 dpf. Images in A–C were acquired with the Zeiss Observer 6.5.32 laser-scanning confocal, with 10× (A) or 20× (B,C) objectives. Images in D were acquired with Leica TCS SPE confocal with a 20× objective. Figures and movies were processed with ImageJ. The zebrafish transgenic lines Tg(mpeg1:Gal4-VP16/UAS-E1b:Kaede) and Tg(mpeg1:mCherry-F) were previously described in other reports (Ellett et al., 2011; Bernut et al., 2014). Scale bars: (A) 200 μm; (B,C) 25 μm; (D) 10 μm.