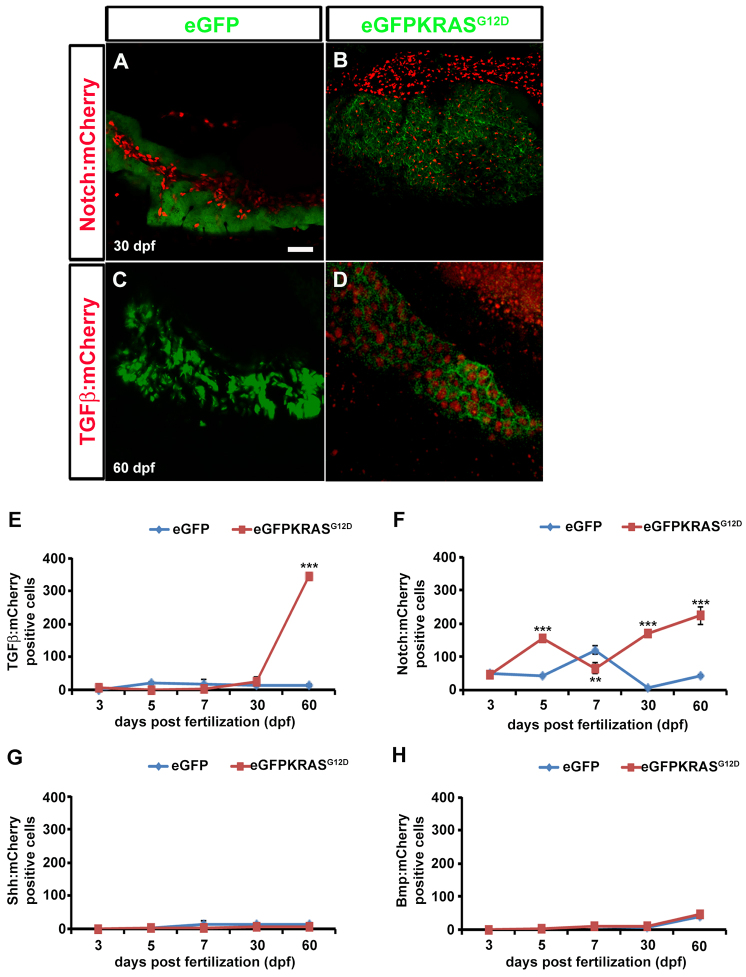
Fig. 5.
TGFβ, Notch, Shh and Bmp signaling activities during pancreatic cancer onset. TGFβ, Notch, Shh and Bmp signaling activities were evaluated by observing mCherry expression using confocal microscope analysis. (A–D) Pictures of full Z-stacks from 30 and 60 dpf samples. Controls obtained by outcrossing the Tg(ptf1a:eGFP) zebrafish line with TGFβ (A) and Notch (C) mCherry reporter lines. TGFβ (B) and Notch (D) signaling activity in tumor lines. (E–H) Quantitative analysis of eGFP-KRASG12D-positive cells expressing TGFβ (E), Notch (F), Shh (G) and Bmp (H) mCherry reporters by VOLOCITY 6.0 software. For each time point, 10 eGFP-positive samples were analyzed. Results for TGFβ (E) and Notch (F) signaling were statistically significant. Error bars indicate s.e.m. for all analyzed samples; **P<0.01, ***P<0.005 according to ANOVA test.

