. 2014 May 30;3:e02184. doi: 10.7554/eLife.02184

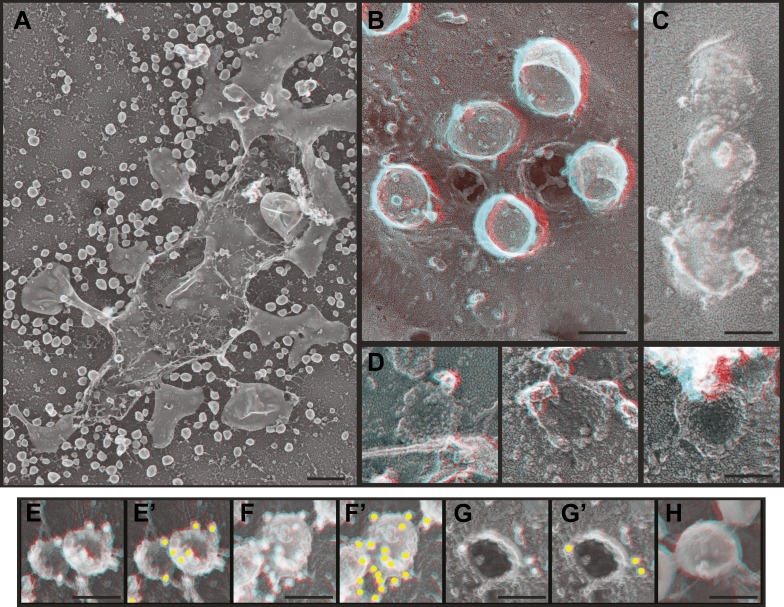
Figure 5. Deep-etch EM of HIV-1 VLP budding.

(A) Low magnification view of an unroofed HIV-1 Gag-transfected HEK293T cell surrounded by VLPs. (B) Top view of whole cell budding VLPs. (C) View of unroofed plasma membrane showing bumps corresponding to VLPs trapped underneath the membrane. (D) Views of unroofed plasma membrane showing Gag assemblies exposed on the cytoplasmic surface of the plasma membrane. (EH) Immunodecoration of Gag on detergent extracted plasma membranes (E and E′), detergent extracted VLPs (F and F′), intact unroofed plasma membranes (G and G′) and intact VLPs (H). (E′, F′ and G′ are same as E, F and G but show gold in yellow). Use view glasses for 3D structure (left eye = red). Scale bars represent (A) 500 nm, (BH) 100 nm.

DOI: http://dx.doi.org/10.7554/eLife.02184.008

Figure 5.

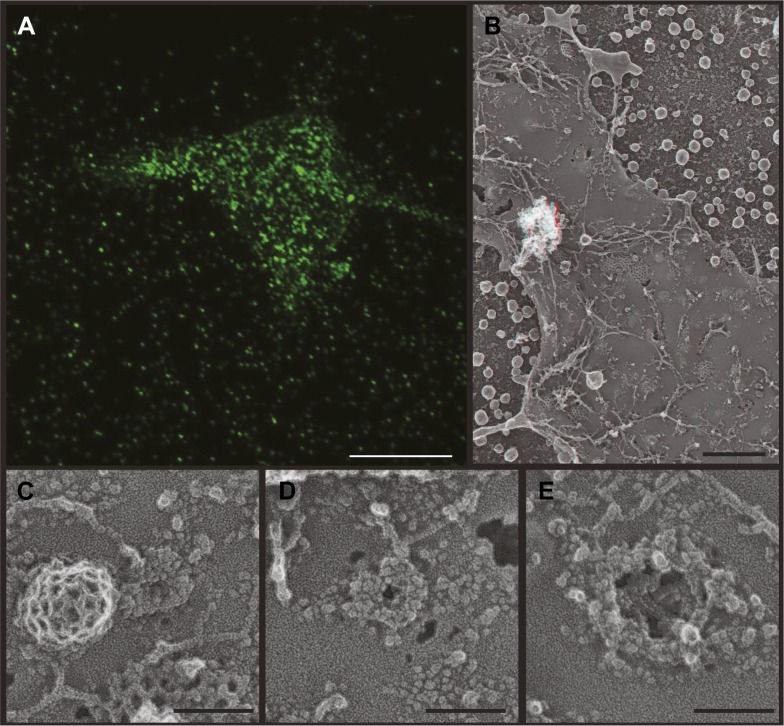
Figure 5—figure supplement 1. VLP formation by HIV-1 Gag-GFP.

Figure 5—figure supplement 1.

(A) Fluorescence microscopy of a live Gag-GFP expressing HEK293T cell showing released VLPs captured around the single cell. Scale bar represents 10 μm. (B) Low magnification view of an unroofed Gag-GFP transfected HEK293T cell surrounded by VLPs. Use view glasses for 3D structure (left eye = red). Scale bar represents 500 nm. (CE) High magnification views of developing Gag assemblies on the plasma membrane of unroofed cells. Small Gag-GFP assemblies (C) resemble those formed by untagged Gag, while larger assemblies (E) are discontinuous and do not form solid spherical assemblies. Scale bars in CE represent 100 nm.